

Hoo boy. Wakely Consulting projects effectuated ACA enrollment to drop 3.8 - 5.8M this year
Wed, 04/15/2026 - 4:02pm
...I'm bringing all of this back up again today because I strongly suspect that the situation is about to reverse itself, with the Trump Administration already preparing to brag about impressive-sounding ACA enrollment numbers for 2026 in spite of the enhanced tax credits expiring less than 60 hours from now...even though the actual negative impact of the expiring tax credits (along with several other administrative policy changes made by CMS this year) likely won't be known for several months after Open Enrollment officially ends in January.
...I honestly don't know exactly what it will look like. The main point to keep in mind is that CMS is unlikely to actually publish that data until sometime in July 2026 if at all, so any crowing by the Trump Administration, Congressional Republicans or their allies about the tax credits expiring having a "minimal impact" etc. should be taken with a massive grain of salt until then.
...the above is fairly minor compared to the most egregiously misleading claim in the WSJ piece, which appears in the next paragraph:
The Congressional Budget Office’s ObamaCare baseline in 2024 assumed 18.9 million people would enroll in plans this year if the enhanced subsidies vanished.
Let's take a look at that CBO "baseline," shall we?
On the surface it looks legit: As of July 2024, the CBO projected that ACA Marketplace Enrollment (both subsidized & unsubsidized combined) would indeed be around 18.9 million people in 2026.
HOWEVER, there's an extremely important footnote regarding what that 18.9 million figure refers to:
The estimates in this table underlie CBO’s June 2024 baseline projections of net federal subsidies for the premium tax credit and related spending. Estimates are for average monthly enrollment over the course of a year and include spouses and dependents covered under family policies.
Average monthly enrollment over the course of a year.
In other words, the CBO didn't say that they only expected 18.9 million people to select plans during the 2026 Open Enrollment Period.
What they said is that they expect the average monthly enrollment over the full 12-month period of 2026 to be around 18.9 million people.
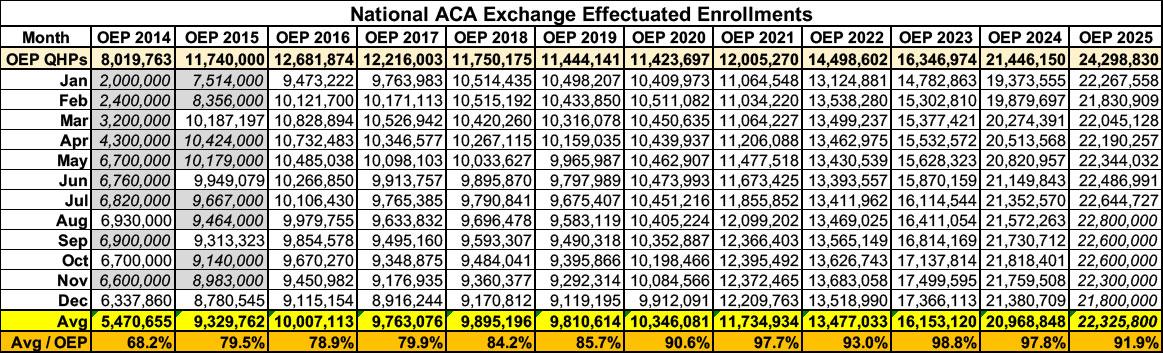
Not only has the average monthly effectuated enrollment varied widely over the years, it's also varied as a percent of total plan selections during the annual Open Enrollment Period.
Distregarding 2014 & 2015 (when the ACA exchanges were still establishing themselves and the monthly effectuation data was spotty), prior years fall into two categories: 2016 - 2020, when the original premium tax credit formula was used, and 2021 - 2025, when enhanced premium tax credits (ePTC) were in place.
During the pre-ePTC years, average effectuated enrollments were clustered right around the ~10.0 million mark ranging from 9.8 - 10.3 million each year.
During the ePTC years, average effectuated enrollment has grown dramatically each year, from ~11.7 million in 2021 all the way up to ~22.4 million in 2025.
I then posted a couple of tables & graphs which broke out effectuated enrollment for every month by year, compared to the plan selections during the Open Enrollment Period for each year, from 2014 - 2025. As I noted, the data for 2014 & 2015 is spotty (CMS was pretty scattershot about regular data reports the first two years), but all of the numbers from January 2016 - July 2025 are via official CMS Public Use Files, and the rounded-off estimates for August - December 2025 are also via the official CMS Medicaid/CHIP enrollment reports.
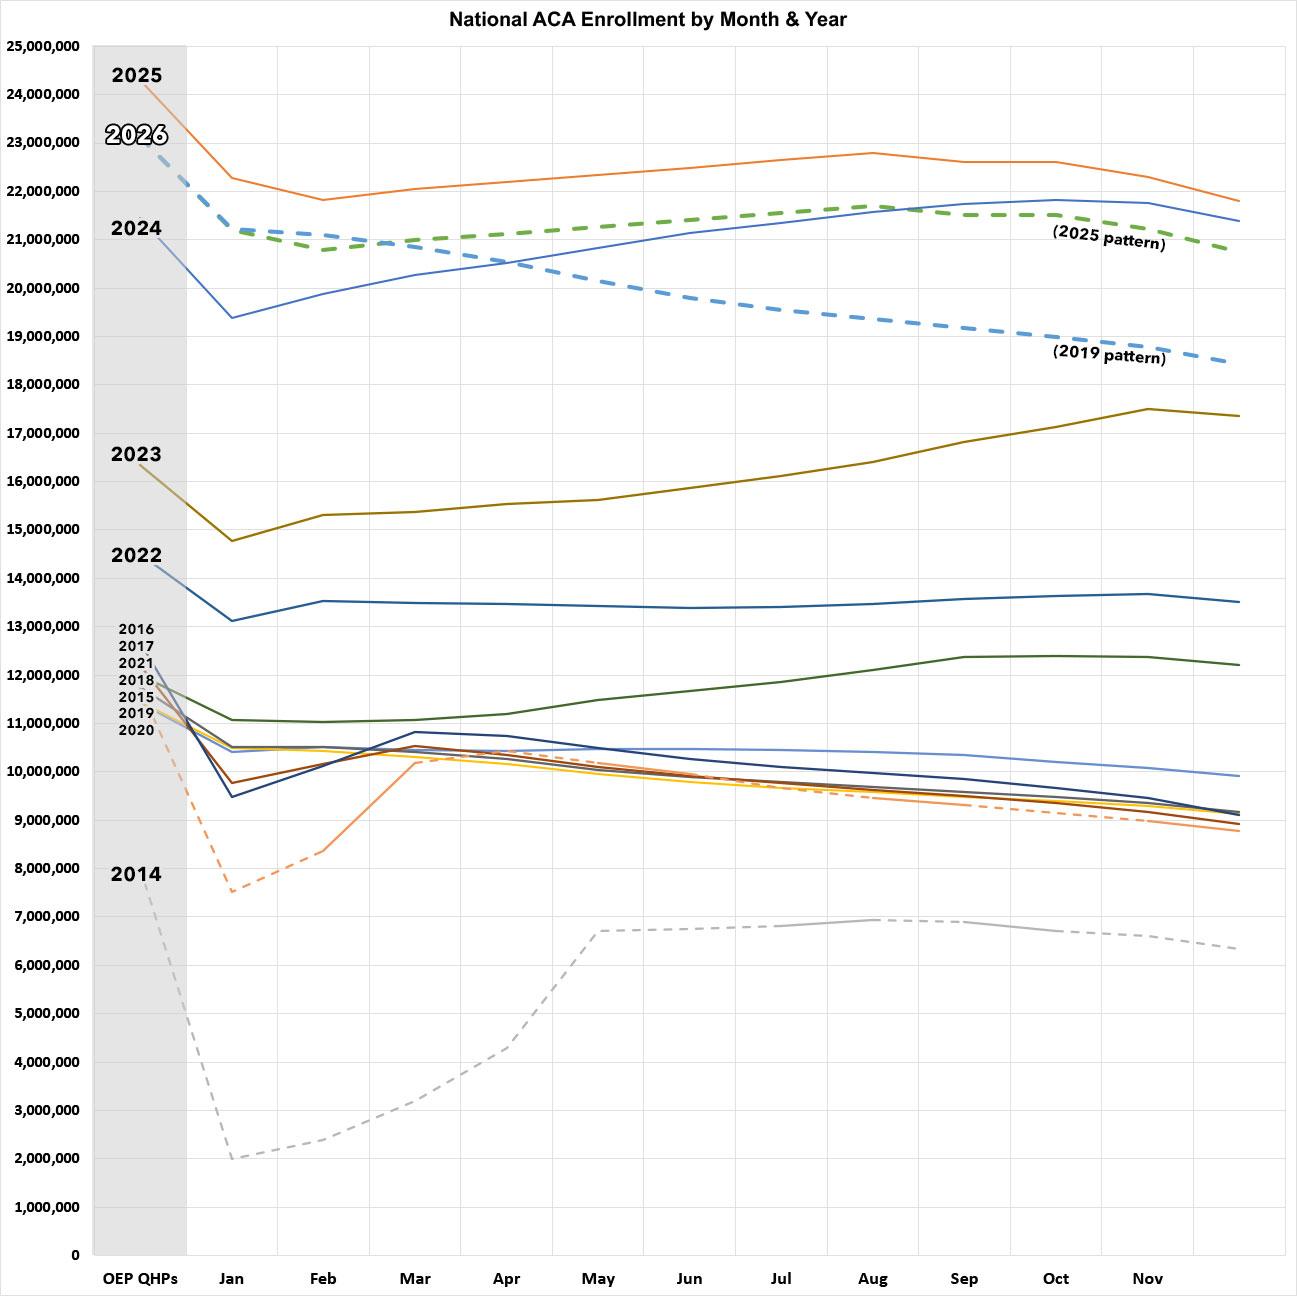
I've updated both the table & graph to reflect additional CMS data which has been published since January:
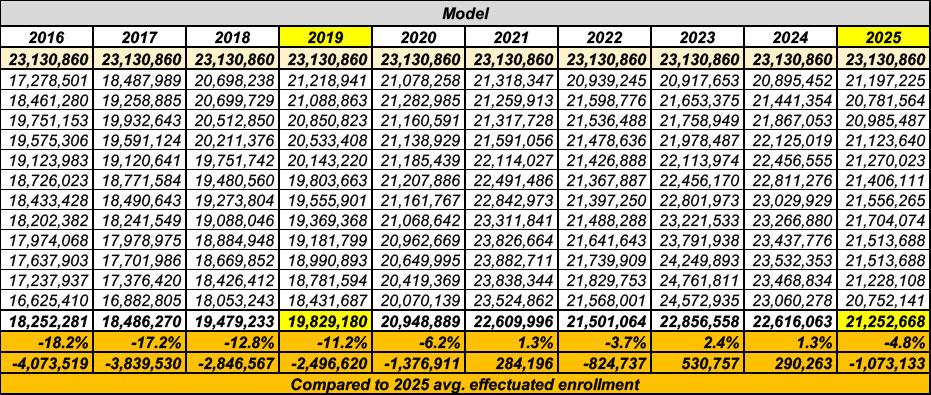
OK, so what about 2026? Well, again, back in January I plugged in what effectuated enrollment would look like in 2026 assuming it follows the same pattern as prior years. In addition to 2025, the best model to look at is the most-recent year prior to enhanced tax credits being put into place.
Normally this would be 2020, but of course that was a complete mess due to the COVID pandemic hitting hard & shutting down the entire country in March/April; in terms of ACA enrollment, many states re-opened enrollment to everyone for anywhere from a month or so to the entire rest of the year, so that's not a great comparison. That leaves 2019 as the last "normal" year before the subsidies were beefed up & expanded to enrollees earning more than 400% of the Federal Poverty Level; I've highlighted 2019 & 2025 below:
In the graph, the thick dotted blue & red lines show what effectuated enrollment would look like over the course of 2026 assuming it follows either the pattern from last year (2025) or the pattern from 2019.
If it follows 2025, average effectuated enrollment will be down roughly 4.8% vs. last year (1.1 million fewer people).
If, however, it follows the 2019 pattern, average enrollment will be down more than double that: Over 11% lower, or 2.5 million fewer enrolled.
OK, but what if it's even worse than that? Remember, it's not just a matter of going back to the pre-enhanced subsidy formula (although that's the biggest change this year); there's also several other big changes:
- For one thing, the Trump Regime has also reverted the non-enhanced tax credit formula to be even less generous yet than it has been the past 5 years for those still eligible.
- For another, the Trump Regime has also eliminated the year-round special enrollment period for Americans who earn less than 150% of the Federal Poverty Level (FPL) which was put into place by the Biden Administration. This is a pretty big deal seeing how over 11 million exchange enrollees (nearly half of the total) earn less than 150% FPL.
- Finally, the Trump Regime also eliminated subsidy eligibility for several hundred thousand legally-residing immigrants who aren't eligible for Medicaid.
Finally, there's this point which I reiterated the other day:
As I've mentioned a few times before, however, it's important to keep in mind that under the ACA, insurance carriers are required to provide a 90-day grace period for enrollees to pay past-due premiums. This means that enrollees whose 2026 policies went into effect on January 1st had until the last day of March to make their first premium payment...which, in turn, means that there will likely be a significant drop in effectuated enrollment which won't actually show up until data for April is published...which likely won't happen until sometime in July for most states...although hopefully Colorado and a few other state-based exchanges will publish it sooner than that.
And that finally brings me to this report from Wakely Consultants, one of the world's leading actuarial firms:
Wakely Consulting Group, an HMA Company, today released a new analysis of the Affordable Care Act (ACA) individual market that points to meaningful changes in enrollment, consumer behavior, and overall market morbidity as 2026 progresses. Drawing on data representing approximately 80% of the market, the findings highlight early indicators that could shape pricing, participation, and policy impacts heading into 2027.
The analysis finds that while initial plan selection data1 suggested only modest declines in enrollment, a deeper look at premium payment behavior tells a more complex story. On average, only 86% of enrollees paid their first premiums in January 2026, with significant variation across states.
What does this mean in real world terms?
- Enrollment declines may be more substantial than early data suggests.
While plan selections declined by roughly 5%, actual enrollment is projected to fall between 17% and 26% on average when accounting for unpaid premiums and ongoing attrition. Some states may see reductions higher than 26%, with higher reductions skewing toward states operating under a Federally Facilitated Exchange.
A 17 - 26% net average effectuated enrollment drop in 2026 vs. 2025 would translate into a much higher drop-off than either the 2025 or 2019 models above...the only years within this range are 2016 & 2017, and those are still at the lower end of Wakely's projections.
A 17% drop would amount to average effectuated exchange enrollment of ~18.5 million, down ~3.8 million year over year.
A 26% drop would amount to average effectuated exchange enrollment of just ~16.5 million, down ~5.8 million year over year.
But wait, there's more:
- Premium payment behavior is a critical indicator of market stability.
States with higher premium increases and higher rates of automatic reenrollment tended to have lower payment rates, signaling more potential coverage losses as the year progresses.
- Consumers are shifting to lower-cost coverage options with less generous benefits.
Enrollment in Bronze plans increased significantly, while Silver plan participation declined. Gold plan enrollment also increased in many states where Silver is more expensive than Gold coverage, driven by low-income members, who are eligible for cost-share reduction Silver plans, buying "down" to save on premiums. These changes suggest that affordability pressures are driving consumers to accept higher potential out-of-pocket costs in exchange for lower premiums.
This is exactly the point I made in my deep dive into the Metal Level shifts from 2025 to 2026.
What about next year?
- The risk pool is expected to worsen.
The analysis estimates that morbidity could increase between 2.9% and 6.5% in 2026, as healthier individuals are more likely to exit the market.
Yep. This is classic "Death Spiral" behavior: As premiums spike, the healthiest enrollees drop out, which causes the average cost to treat those remaining to increase, which in turn causes premiums to spike more...
- State-level variation is pronounced.
State-based exchanges generally retained more enrollees and experienced less disruption than Federally Facilitated Exchanges, underscoring the importance of local policy and program design. Even within state cohorts, significant variation is evident.
I haven't had time to read through the entire report itself, but this table & section, which relate to the last bullet above, jumped out at me:
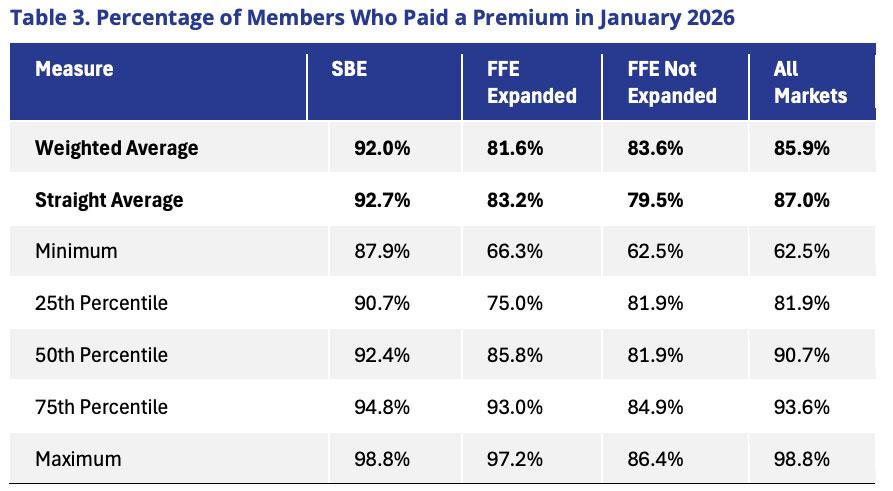
It is important to note the amount and potential reasoning for variation in payment rates. The data Wakely collected showed that the 25th percentile was approximately 82% of paid premiums, and the 75th percentile nearly 94% of members paid their premiums. This variation is even more pronounced depending on the type of Exchange and if the state had expanded Medicaid.
Generally, SBE states had a higher proportion of members who paid premiums. Many SBEs had state subsidy programs and extensive outreach programs, which likely improved member retention. There are currently 10 state subsidy programs in the individual market. All 10 of these states are also SBEs. Several of these states have substantial state subsidy programs. For example, New Mexico’s state subsidy program fully offsets the reduction in federal subsidies for 2026.
Conversely, FFE states had a lower percentage of members with paid premiums than SBE states. Within FFE states, most states that expanded Medicaid on a straight average basis, saw more members paying premiums than did FFE states without Medicaid expansion, although the difference between the two was insubstantial, and a number of FFE Medicaid expansion states had high premium payment rates.
I'm sure I'll have more to say about this report soon, but I'll leave it at that for now.
Advertisement
