With the pending dire threat to several of these programs (primarily Medicaid & the ACA) from the House Republican Budget Proposal which recently passed, I'm going a step further and am generating pie charts which visualize just how much of every Congressional District's total population is at risk of losing healthcare coverage.
USE THE DROP-DOWN MENU ABOVE TO FIND YOUR STATE & DISTRICT.
Political battles are usually won based on appealing to emotion, not to facts, policy or logic.
However, you should still have those facts at your disposal for two reasons: First, they still help you craft appeals to emotion. Second, they also help you craft the actual policy. Besides, I'm a data guy; my primary job is to help put facts & policy into easily-understandable context.
With the pending dire threat to several of these programs (primarily Medicaid & the ACA) from the House Republican Budget Proposal which recently passed, I'm going a step further and am generating pie charts which visualize just how much of every Congressional District's total population is at risk of losing healthcare coverage.
USE THE DROP-DOWN MENU ABOVE TO FIND YOUR STATE & DISTRICT.
Moments ago House Republicans joined Senate Republicans in passing H.R. 1, aka the "One Big Beautiful Bill," aka the MAGA Murder Bill, into final passage.
Donald Trump will presumably sign it into law sometime today or perhaps tomorrow...the 4th of July.
Many horrific things are about to happen. On the healthcare front, some will happen sooner (ACA IRA subsidies expire in less than 6 months, and enrollees should start getting hit with sticker shock about that sometime in October); some later (Medicaid "reporting requirements" go into effect after the midterms in late 2026).
A dark day for America, democracy and decency, which was pretty much inevitable when the polls closed on November 5, 2024.
This is what you voted for, America, whether you "meant it" at the time or not.
I'll have more--much more--to say soon, but I'm very tired, very depressed, very angry, very sickened and need some time to gather my thoughts and sanity.
With the pending dire threat to several of these programs (primarily Medicaid & the ACA) from the House Republican Budget Proposal which recently passed, I'm going a step further and am generating pie charts which visualize just how much of every Congressional District's total population is at risk of losing healthcare coverage.
USE THE DROP-DOWN MENU ABOVE TO FIND YOUR STATE & DISTRICT.
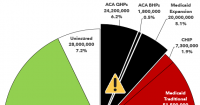
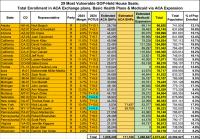
There are 29 House districts where Republicans won by 12 points or less.
Below I've posted district-wide enrollment in ACA exchange-based Qualified Health Plans (QHPs), ACA Basic Health Plans (BHPs) and Medicaid via ACA expansion.
Across these 29 districts alone, a total of nearly 2.7 million Americans are at risk of either losing healthcare coverage entirely or, if they don't, having to deal with MASSIVE premium hikes and/or a MOUNTAIN of paperwork on a regular basis to keep it due to a combination of H.R. 1 (the "One Big Beautiful Bill Act") being implemented, the GOP allowing the IRA subsidies to expire at the end of this year, and the Trump Administration implementing CMS's recent "Integrity Rule" starting this fall.
That's around 12% of the total populations of these districts.